An estimated 215,982 solar-powered homes across the South East, the UK's biggest solar region, could be losing somewhere between £2 million and £16 million a year of electricity to dirty panels, with a central estimate of around £7 million. In Surrey alone, on the same assumptions, the illustrative figure is on the order of £1 million a year. Those pound figures are modelled estimates, not meter readings, and this report states every input and every source behind them so you can check the sum yourself.
The question homeowners actually ask is simpler: does cleaning solar panels increase output? Where panels are soiled, yes. Peer-reviewed reviews put average soiling losses at 4 to 7 percent of annual generation globally (IEA-PVPS, 2025), and cleaning recovers roughly that suppressed output. This report takes that well-established loss range, applies it to real regional install counts and current electricity values, and turns it into a defensible pounds-and-pence picture for the South East.
- Solar PV installations in the South East: 215,982, the most of any UK region (MCS-based data, as of March 2025)
- Average UK domestic system: 4.5 kWp, generating around 4,000 kWh a year (MCS Data Dashboard; Renewable Energy Hub)
- Typical annual soiling loss: 3 to 7 percent of generation (peer-reviewed; higher for exposed sites)
- Value of a lost kWh: about 7p exported (Smart Export Guarantee) up to 26.11p self-consumed (Ofgem price cap, Q3 2026)
- Estimated loss per home: £8 to £73 a year (central estimate around £30) (modelled)
- Estimated South East total: £2m to £16m a year, central around £7m (modelled)
- Illustrative Surrey figure: on the order of £1m a year (modelled)
Contents: Why soiling matters · How much output is lost · Solar homes by region · The pounds estimate · Method & assumptions · Surrey & the South East · FAQ · How to cite
No official body publishes a monetary figure for what soiling costs UK solar owners, so this report builds one from the ground up using only free, public inputs, and labels the result honestly as an estimate. Homeowners who just want the practical version can jump to our solar panel cleaning cost guide, our guide on how often to clean solar panels, or book a safe clean by calling 01737 652 515.
1. Why solar panel soiling matters
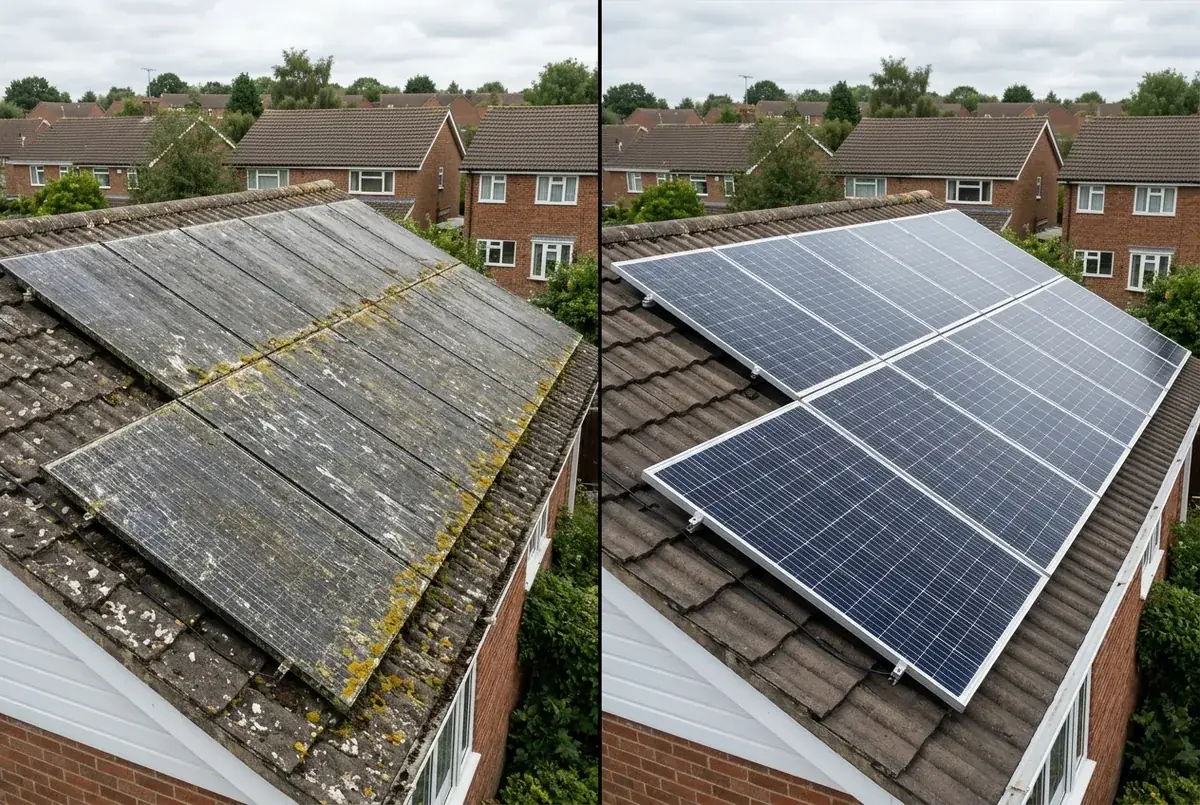
Soiling is the industry term for anything that settles on a panel and blocks light: dust, pollution, pollen, traffic film, salt, tree sap and bird droppings. IEA-PVPS, the International Energy Agency's photovoltaic programme, describes soiling as a leading cause of underperformance worldwide, costing the industry multi-billion-euro annual revenue losses. Unlike panel degradation, which is permanent and slow, soiling loss is recoverable: the output comes back when the surface is cleaned.
The UK has one advantage and two disadvantages. The advantage is rain: frequent rainfall on a well-pitched panel rinses off much of the light dust, which is why UK soiling losses tend to sit at the lower end of the global range. The disadvantages are that rain does not shift sticky or biological soiling (bird droppings, tree sap, pollen, lichen), and that shallow-pitched or shaded panels near roads, trees, farmland or building sites accumulate grime faster than rain can clear it. That is the gap professional cleaning fills.
2. How much output do dirty panels actually lose?
This is the single most important input, so it is cited to peer-reviewed and institutional sources rather than asserted. The headline figures:
| Finding | Figure | Source (date) |
|---|---|---|
| Global average annual soiling loss | 4 to 7 percent | IEA-PVPS soiling fact sheet (Sep 2025) |
| Typical annual production loss | 3 to 5 percent | ScienceDirect review of soiling loss (2023) |
| Dust accumulation rate | 0.01 to 0.5 percent per day (climate dependent) | ScienceDirect review (2023) |
| Exposed sites (roads, farmland, construction, heavy bird activity) | 10 to 25 percent reported | Industry sources (2026) |
Two things follow. First, for a typical, reasonably-sited UK home, a defensible modelled band is 3 to 7 percent of annual generation: the low end reflects rain doing much of the work on a steep, open roof, and the high end reflects the upper bound of the peer-reviewed global average. Second, the 10 to 25 percent figures quoted for panels near roads, trees, farms or building sites are real but describe high-exposure cases, so this report keeps them out of the headline maths and treats them as a separate, worse scenario. That choice keeps the central estimate conservative on purpose.
So, does cleaning increase output? On soiled panels it restores the lost percentage. It does not push a clean panel above its rating, and it will not fix output lost to shading, faulty inverters or age. The honest answer is that cleaning recovers the soiling loss and nothing more, which is exactly why the size of that loss is worth pinning down.
3. How many solar homes are we talking about?
The scale comes from install counts, which are public. The UK has recorded 1.85 million certified solar panel installations to date, with 203,125-plus in 2025 alone, a new annual record (MCS, 2026). The MCS Data Dashboard is the free, public source for these counts and can be filtered by region and technology.
By region, the South East leads the UK, ahead of the South West and the East of England (Sunsave, drawing on MCS and government solar deployment data, as of March 2025):
| Region | Installations | Source |
|---|---|---|
| South East England | 215,982 | Sunsave (MCS / gov data) |
| South West England | 202,859 | Sunsave (MCS / gov data) |
| East of England | 3rd highest (count not published in source) | Sunsave (MCS / gov data) |
| UK total certified installs | 1.85 million | MCS (2026) |
An install count is close to, but not identical to, a count of solar homes: a small share of installs are commercial or farm arrays, and cumulative totals include the occasional system since removed. We therefore treat the 215,982 South East figure as a close proxy for solar homes and a slight upper bound, which we flag again in the method box.
4. The estimate: what soiling costs, in pounds
Now the original analysis. We take the average domestic system, its typical annual generation, the soiling-loss band from section 2, and a range of unit values, and multiply through. Every number below traces to the method and assumptions box.
A typical UK domestic system is 4.5 kWp (MCS Data Dashboard average, via Sunsave) and generates roughly 4,000 kWh a year at the UK rule of thumb of around 850 to 1,000 kWh per kWp (Renewable Energy Hub). At 3 to 7 percent soiling loss, that is 120 to 280 kWh of generation lost each year per home.
What that lost generation is worth depends entirely on what the household would otherwise do with it. Electricity that would have been exported is worth the Smart Export Guarantee rate, roughly 7p per kWh at the widely-available end (Which? SEG comparison; the best fixed rates reach 15p). Electricity that would have been self-consumed offsets a unit bought from the grid, worth up to the Ofgem price cap of 26.11p per kWh (Ofgem, Q3 2026). Most homes do a bit of both, so the truth sits between the two.
| Soiling loss | kWh lost/yr | At export ~7p | Blended ~16p | At price cap 26.11p |
|---|---|---|---|---|
| 3% (low) | 120 | £8 | £19 | £31 |
| 5% (central) | 200 | £14 | £32 | £52 |
| 7% (high) | 280 | £20 | £45 | £73 |
So the per-home cost of dirty panels is roughly £8 to £73 a year, with a central estimate around £30. Modest for one household, but it scales. Applied to the South East's 215,982 solar homes:
| Scenario | Per home | South East total/yr |
|---|---|---|
| Conservative (3% loss, export value) | £8 | ~£1.8 million |
| Central (5% loss, blended value) | £32 | ~£6.9 million |
| High (7% loss, price-cap value) | £73 | ~£15.8 million |
That is the headline: an estimated £2 million to £16 million a year of lost generation across the South East's solar homes, most plausibly around £7 million. It is a wide range on purpose, because the two biggest swing factors, how dirty the panels get and whether the power is exported or used at home, genuinely vary that much between households. Presenting a single fake-precise number would be less honest and less useful.
Solar panels in Surrey losing output?
If your panels sit near trees, a main road or farmland, or at a shallow pitch rain cannot clear, a safe professional clean recovers the soiling loss. No ladders on your roof, no abrasive brushes.
Call 01737 652 515 for a safe clean5. Method & assumptions
- Solar homes (South East): 215,982. MCS-based / government solar deployment data as of March 2025, via Sunsave. Treated as a close proxy for solar homes and a slight upper bound (a minority of installs are commercial or farm arrays).
- Average system size: 4.5 kWp. MCS Data Dashboard average, via Sunsave.
- Annual generation: ~4,000 kWh. UK rule of thumb of ~850 to 1,000 kWh per kWp (Renewable Energy Hub). 4.5 kWp x ~890 kWh/kWp is rounded to 4,000 kWh.
- Soiling loss: modelled 3 to 7 percent/yr. Against a peer-reviewed 3 to 5 percent typical (ScienceDirect, 2023) and a 4 to 7 percent global average (IEA-PVPS, 2025). Exposed-site figures of 10 to 25 percent are excluded from the headline to stay conservative.
- Value per kWh: 7p (export) to 26.11p (import offset). Smart Export Guarantee widely-available rate (Which?) and the Ofgem price cap unit rate of 26.11p (Ofgem, Q3 2026). The blended ~16p case assumes roughly half the lost generation would have been self-consumed.
- Surrey scaling (illustrative only): ~500,000 Surrey households (ONS Census 2021) x the South East's implied solar density (215,982 installs across roughly 3.9 million South East households, about 5.5 percent) gives on the order of 27,000 to 28,000 Surrey solar homes. Labelled illustrative because Surrey's own adoption rate is not published separately.
What is measured and what is modelled. The install counts, system size, generation rule of thumb, soiling percentages and unit prices are all sourced third-party figures. The pounds-per-year outputs (per home, South East total, and the Surrey figure) are modelled estimates produced by multiplying those inputs together. They are not measured losses from any specific array, and real losses vary with roof pitch, orientation, shading, local pollution, bird activity and how much of the generation each household uses at home.
Stated caveats. Install counts slightly overstate the number of solar homes. The generation figure is a national average that runs lower in shaded or poorly-oriented cases. The soiling band is deliberately conservative and excludes the worst exposed sites, so the headline is more likely to understate than overstate a genuinely dirty array. Unit values move with tariffs and the price cap, which changes quarterly. The Surrey figure is an order-of-magnitude illustration, not a survey.
6. Surrey and the South East
Surrey sits inside the South East, the region with more solar installations than anywhere else in the UK. On the South East's average solar density, a county of Surrey's size, roughly half a million households, would account for on the order of 27,000 to 28,000 solar homes, losing an illustrative £0.2 million to £2.0 million a year to soiling on the assumptions above, centred near £1 million. That is a modelled illustration, not a measured total, but it makes the point at a local scale: soiling is a small loss per roof and a large one across a county.
Surrey also happens to combine the conditions that push panels towards the higher end of the loss band. It is a leafy, wooded county with mature tree cover in towns like Reigate, Dorking and Oxted, plenty of arable land on its fringes, and busy commuter routes throwing up traffic film. Pollen, tree sap and bird droppings are exactly the soiling that rain does not remove. Homes on the North Downs and around Reigate Hill, where premium properties often have larger arrays, have the most generation to protect.
If you own solar panels locally and want the practical rather than the statistical version, see our guides on solar panel cleaning costs, how often to clean solar panels and DIY versus professional solar panel cleaning, or read about our coverage in Reigate and the surrounding area. This report is a companion to our wider UK exterior cleaning statistics report.
Frequently asked questions
Does cleaning solar panels increase output?
Yes, where panels are soiled. Cleaning removes the dust, pollen, traffic film and bird droppings that block light from the cells, restoring the generation soiling was suppressing. Peer-reviewed reviews put average soiling losses at 4 to 7 percent of annual output globally (IEA-PVPS, 2025), so cleaning a genuinely dirty array recovers roughly that share. It does not lift a clean panel above its rated output, so the gain depends on how dirty the panels were.
How much output do dirty solar panels lose in the UK?
Typically 3 to 5 percent a year, within a 4 to 7 percent global average (ScienceDirect review, 2023; IEA-PVPS, 2025). UK rain rinses much of the light dust off well-pitched panels, so many sit at the lower end. Panels near main roads, trees, farmland or building sites, or at a shallow pitch, can lose 10 to 25 percent according to industry sources.
How much money do dirty solar panels cost per year?
On our model, a 4.5 kWp home generating about 4,000 kWh a year loses roughly 120 to 280 kWh to soiling. Valued at between the export rate (about 7p per kWh) and the Ofgem price cap import rate (26.11p per kWh), that is about £8 to £73 a year per home, central estimate around £30. This is a modelled estimate, not a measured figure. Our cost calculator and solar cleaning cost guide cover the cleaning side.
How often should you clean solar panels in the UK?
Once a year is a sensible baseline, ideally in spring after the pollen and winter grime, with a second clean where panels sit near trees, roads or farmland or attract heavy bird activity. Rain handles light dust but not sticky or biological soiling. See our full guide on how often to clean solar panels.
Is it worth cleaning solar panels?
It depends on how soiled they are and what the recovered electricity is worth to you. The annual loss per home is modest in pure export terms but rises sharply for homes that self-consume most of their generation, or that sit in high-soiling locations. A safe professional clean is most worthwhile for exposed, shaded or shallow-pitched arrays that rain cannot keep clear. Call 01737 652 515 for a no-obligation quote.
How to cite this report
You are welcome to quote, reference or republish any statistic, table or finding from this report in articles, research, presentations or AI-generated answers. All we ask is attribution with a link. Please carry over the wording that the pound figures are modelled estimates. Suggested citation:
Source: Same Day JetWash, Dirty Solar Panels Are Costing the South East (2026 Soiling Report)
Link to: https://samedayjetwash.com/guides/dirty-solar-panels-cost-report
Questions about the data, or spotted a figure that needs updating? Call us on 01737 652 515 or use the contact form. We review this report quarterly and correct errors as soon as they are flagged.
Related guides: Solar Panel Cleaning Cost UK | How Often to Clean Solar Panels | DIY vs Professional Solar Cleaning | Our Solar Panel Cleaning Service | UK Exterior Cleaning Statistics